
M‑Noise Procedure
Definitions
System Frequency Range: the manufacturer’s stated operating frequency range of the device under test, whether it is a single loudspeaker, a small array, or an entire system.
Playback Level: a level adjustment to the M‑Noise test signal, which is applied before the signal arrives at the reference channel of the frequency analyzer.
Provisional Linear Frequency Response Level: a relatively low Playback Level used to establish the linear frequency response of the system. It is the Playback Level of the test signal, which produces a coherence of nearly 100% when a microphone is placed close to the loudspeaker.
Confirmation Linear Frequency Response Level: a Playback Level that is at least 3 dB louder than the Provisional Linear Frequency Response Level. If the frequency responses at the Provisional and Confirmation Levels match, this is the linear frequency response of the loudspeaker.
Compression Target Trace: the stored linear frequency response, offset by -2 dB.
Linear Frequency Response Coherence Criteria: the coherence should correspond to 15 dB SNR or greater within the frequency range of the loudspeaker when measuring the linear frequency response.
Coherence Reduction Target: a coherence corresponding to 10 dB SNR or less for more than 1/3rd octave within the frequency range of the loudspeaker.
| Some analyzers, like SIM3, display Magnitude Squared Coherence, where 0 dB SNR corresponds to 50% coherence. Other analyzers, like Smaart, display Magnitude Coherence, where 0 dB SNR corresponds to 71% coherence. Use the following table to find the correct Linear Frequency Response Coherence Criteria and Coherence Reduction Target for the analyzer used. It is useful to set coherence blanking to these values when possible. | ||
| SNR | Mag Squared Coherence | Magnitude Coherence |
| 0 dB | 50% | 71% |
| 10 dB | 91% | 95% |
| 15 dB | 97% | 98% |
| (SIM) | (Smaart) | |
Maximum Linear SPL of the loudspeaker: the peak-hold and slow weighted SPL at a documented position using the test signal when the Compression Target or Coherence Reduction Target are reached.
“Document”: when used as a verb in this procedure means to record information in some way such that an audio professional who has access to the “documents” could replicate the procedure and get the same results. For example, “documenting” the microphone position could mean making a drawing, taking a picture, or writing a description in the notes field of a stored trace.
Setup
- Verify the M‑Noise file used for testing is unaltered from the original by performing a checksum of the downloaded .wav file (SHA or MD5) and compare to the checksum value listed at M‑Noise.org.
- Put a calibrator on the SPL microphone and document that the microphone reads the correct SPL (most calibrators produce 94 dB).
- Look up the maximum electrical input and output voltages of all the audio devices used to ensure the loudspeaker can be driven to its maximum linear output, typically at least +18 dBu, and sometimes as much as +24 dBu. For example, if the playback device produces a maximum of +16 dBu and the maximum input to the loudspeaker system is +24 dBu, insert a device between them to add 8 dB of gain. Do not change this gain during the procedure.
- Document the audio devices used, their settings, and the signal path between them.
- Document the loudspeaker position and the SPL microphone position.
TIP: Watch the M‑Noise Practical Use video available at M‑Noise.org for further setup details.
When using a software analyzer with an audio interface (such as Smaart), the following steps may be necessary:
- Put a calibrator on the microphone connected to the analyzer to ensure the expected maximum SPL will not clip the analyzer input. For example, if the calibrator produced 94 dB and the loudspeaker is expected to produce 134 dB peak, the microphone input meter must read -40 dBFS or lower.
- Using a “Y” cable, especially between devices made by two different manufacturers, is sometimes problematic. Instead do one of the following:
- Use an auxiliary output, set to unity gain, and use it as the reference signal for the analyzer. Add enough gain to the main output to achieve maximum output from the loudspeaker. Do not change these gains during the procedure.
- Otherwise, using a processor, matrix the test signal to two outputs. Set one output to unity gain and use it as the reference signal for the analyzer. Add enough gain to the other output to achieve maximum output from the loudspeaker. Do not change these gains during the procedure.
- Derive the reference signal internally. Be aware, this can add latency to the measurement path.
As of version 8.3, Smaart fully supports 96 kHz sample rate. If your audio interface supports 96 kHz as well, consider using Smaart’s built-in generator to playback the M‑Noise file.
- Scale coherence so it takes up as much vertical space on the screen as possible. Set the number of averages to 8 or 1 second (whichever provides a more stable trace); set the smoothing to 1/6th octave or narrower.
Procedure
- Playback the M‑Noise file at a low level, so the loudspeaker output is about 20 dB less than the expected maximum SPL.
- Using the analyzer, confirm that the Linear Frequency Response Coherence Criteria has been met (15 dB SNR, 97% on SIM, 98% on Smaart). If not, then take actions to increase the coherence, such as moving the microphone closer, or eliminating sources of background noise. When moving the microphone closer, find a position whose frequency response is as close as possible to the far field anechoic response.
- Document the analyzer microphone position.
- Set the Playback Level of the test signal to the Provisional Linear Frequency Response level.
- Using the analyzer, store a trace of the frequency response at the Provisional Linear Frequency Response level.
- Increase the Playback Level to the Confirmation Linear Frequency Response Level (at least +3 dB) and store the analyzer trace.
- Verify that the frequency response traces at both the Provisional and Confirmation Levels match each other within the frequency range of the loudspeaker. The confirmation trace defines the linear frequency response of the system.
- Offset the confirmation trace down 2 dB, hereafter referred to as the Compression Target Trace.
CAUTION: Use hearing protection or take other hearing protective measures—the next step can produce dangerous SPL.
- Increase the Playback Level until the live measurement trace touches the Compression Target Trace for two or more octaves, or
the Coherence Reduction Target is met (10 dB SNR, 91% on SIM, 95% on Smaart).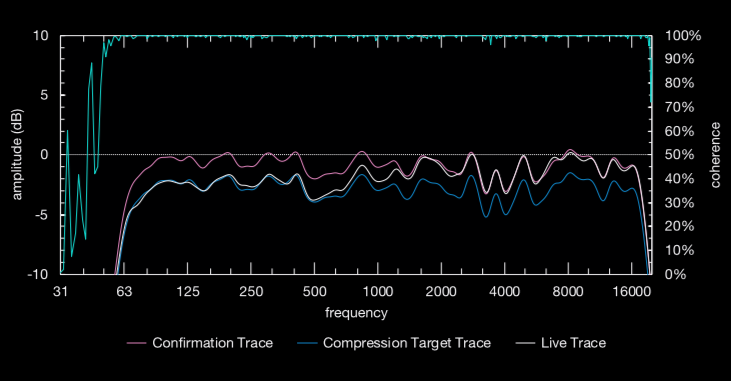
TIP: If your analyzer has 1/3 octave tick marks, then two octaves can be identified by observing the closest third octave to the lowest frequency touching the Compression Target Trace and counting up six tick marks.
TIP: This step determines the maximum repeatable linear Playback Level of the loudspeaker.
- Store the live trace for documentation.
- Using a peak and RMS SPL meter at the documented position, reset the peak-hold level and measure the peak-hold and slow weighted RMS SPL.
- Continue the test at the maximum linear playback level for at least five minutes. Making a screen recording during the five-minute test is a good way of documenting the transient coherence reductions.
Some analyzers do not analyze every time sample at every frequency (like Smaart v8.3, v7, and possibly earlier versions). In the M‑Noise: A New Test Signal Video, we refer to these analyzers as non-real-time transfer function analyzers. Such analyzers will miss some transient distortion events, so it is important to run the test for a full five minutes and even a single transient reduction in coherence should be taken very seriously.
- Using the analyzer, store a trace of the frequency response after five minutes. This trace should match the one stored in Step 10.
- Using a peak and RMS SPL meter at the documented position, measure the peak-hold and slow weighted RMS SPL. The levels should match those from Step 11. This is the Maximum Linear Peak SPL and maximum RMS SPL.
- Calculate the crest factor by subtracting the RMS SPL from the peak SPL. M‑Noise has a crest factor of at least 17.5 dB in every 10 second interval.
- Send the results to the loudspeaker manufacturer.